MY ESG PLANET
Simplifying Enterprise ESG Management and Reporting
COMPANY
RGBSI
ROLE
Design Lead
EXPERTISE
Product Design
YEAR
2025
Project Overview
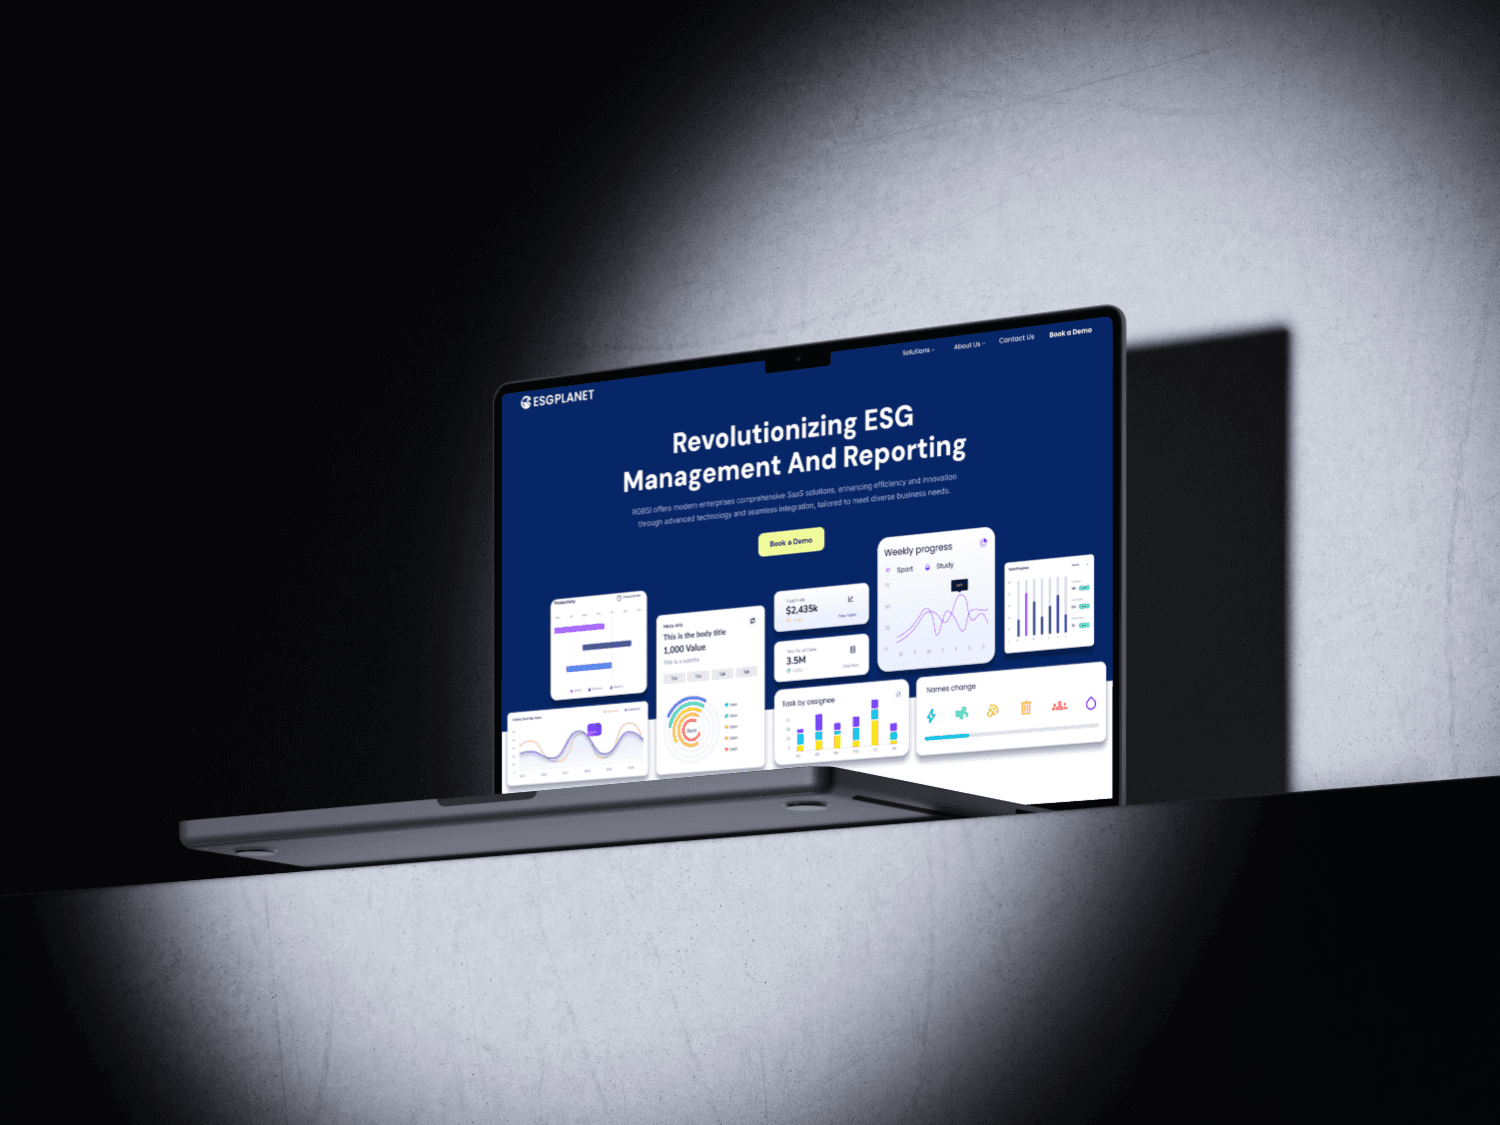
My ESG Planet is an enterprise platform for collecting, monitoring, and reporting environmental, social, and governance data. It transforms complex measures—such as Scope 1–3 emissions, energy intensity, water use, workforce indicators, approvals, and reporting periods—into workflows that sustainability teams can manage with confidence.
The challenge
ESG reporting brings together large volumes of data from different facilities, teams, units, and time periods. Users need to understand progress, identify gaps, compare performance, approve submissions, and produce reports without losing traceability. The UX challenge was to make this complexity navigable while preserving the precision expected from an enterprise reporting system.
My role
As Design Lead, I shaped the product direction, information architecture, dashboard hierarchy, reporting patterns, and visual system. The work focused on aligning environmental and social workflows while keeping metrics, units, dates, organization context, and export actions consistently visible.
Design Process
The design process moved from the reporting model outward: first clarifying the data hierarchy, then defining the tasks around collection and review, and finally creating dashboard and report patterns that could scale across ESG categories.
1. Structuring the reporting model
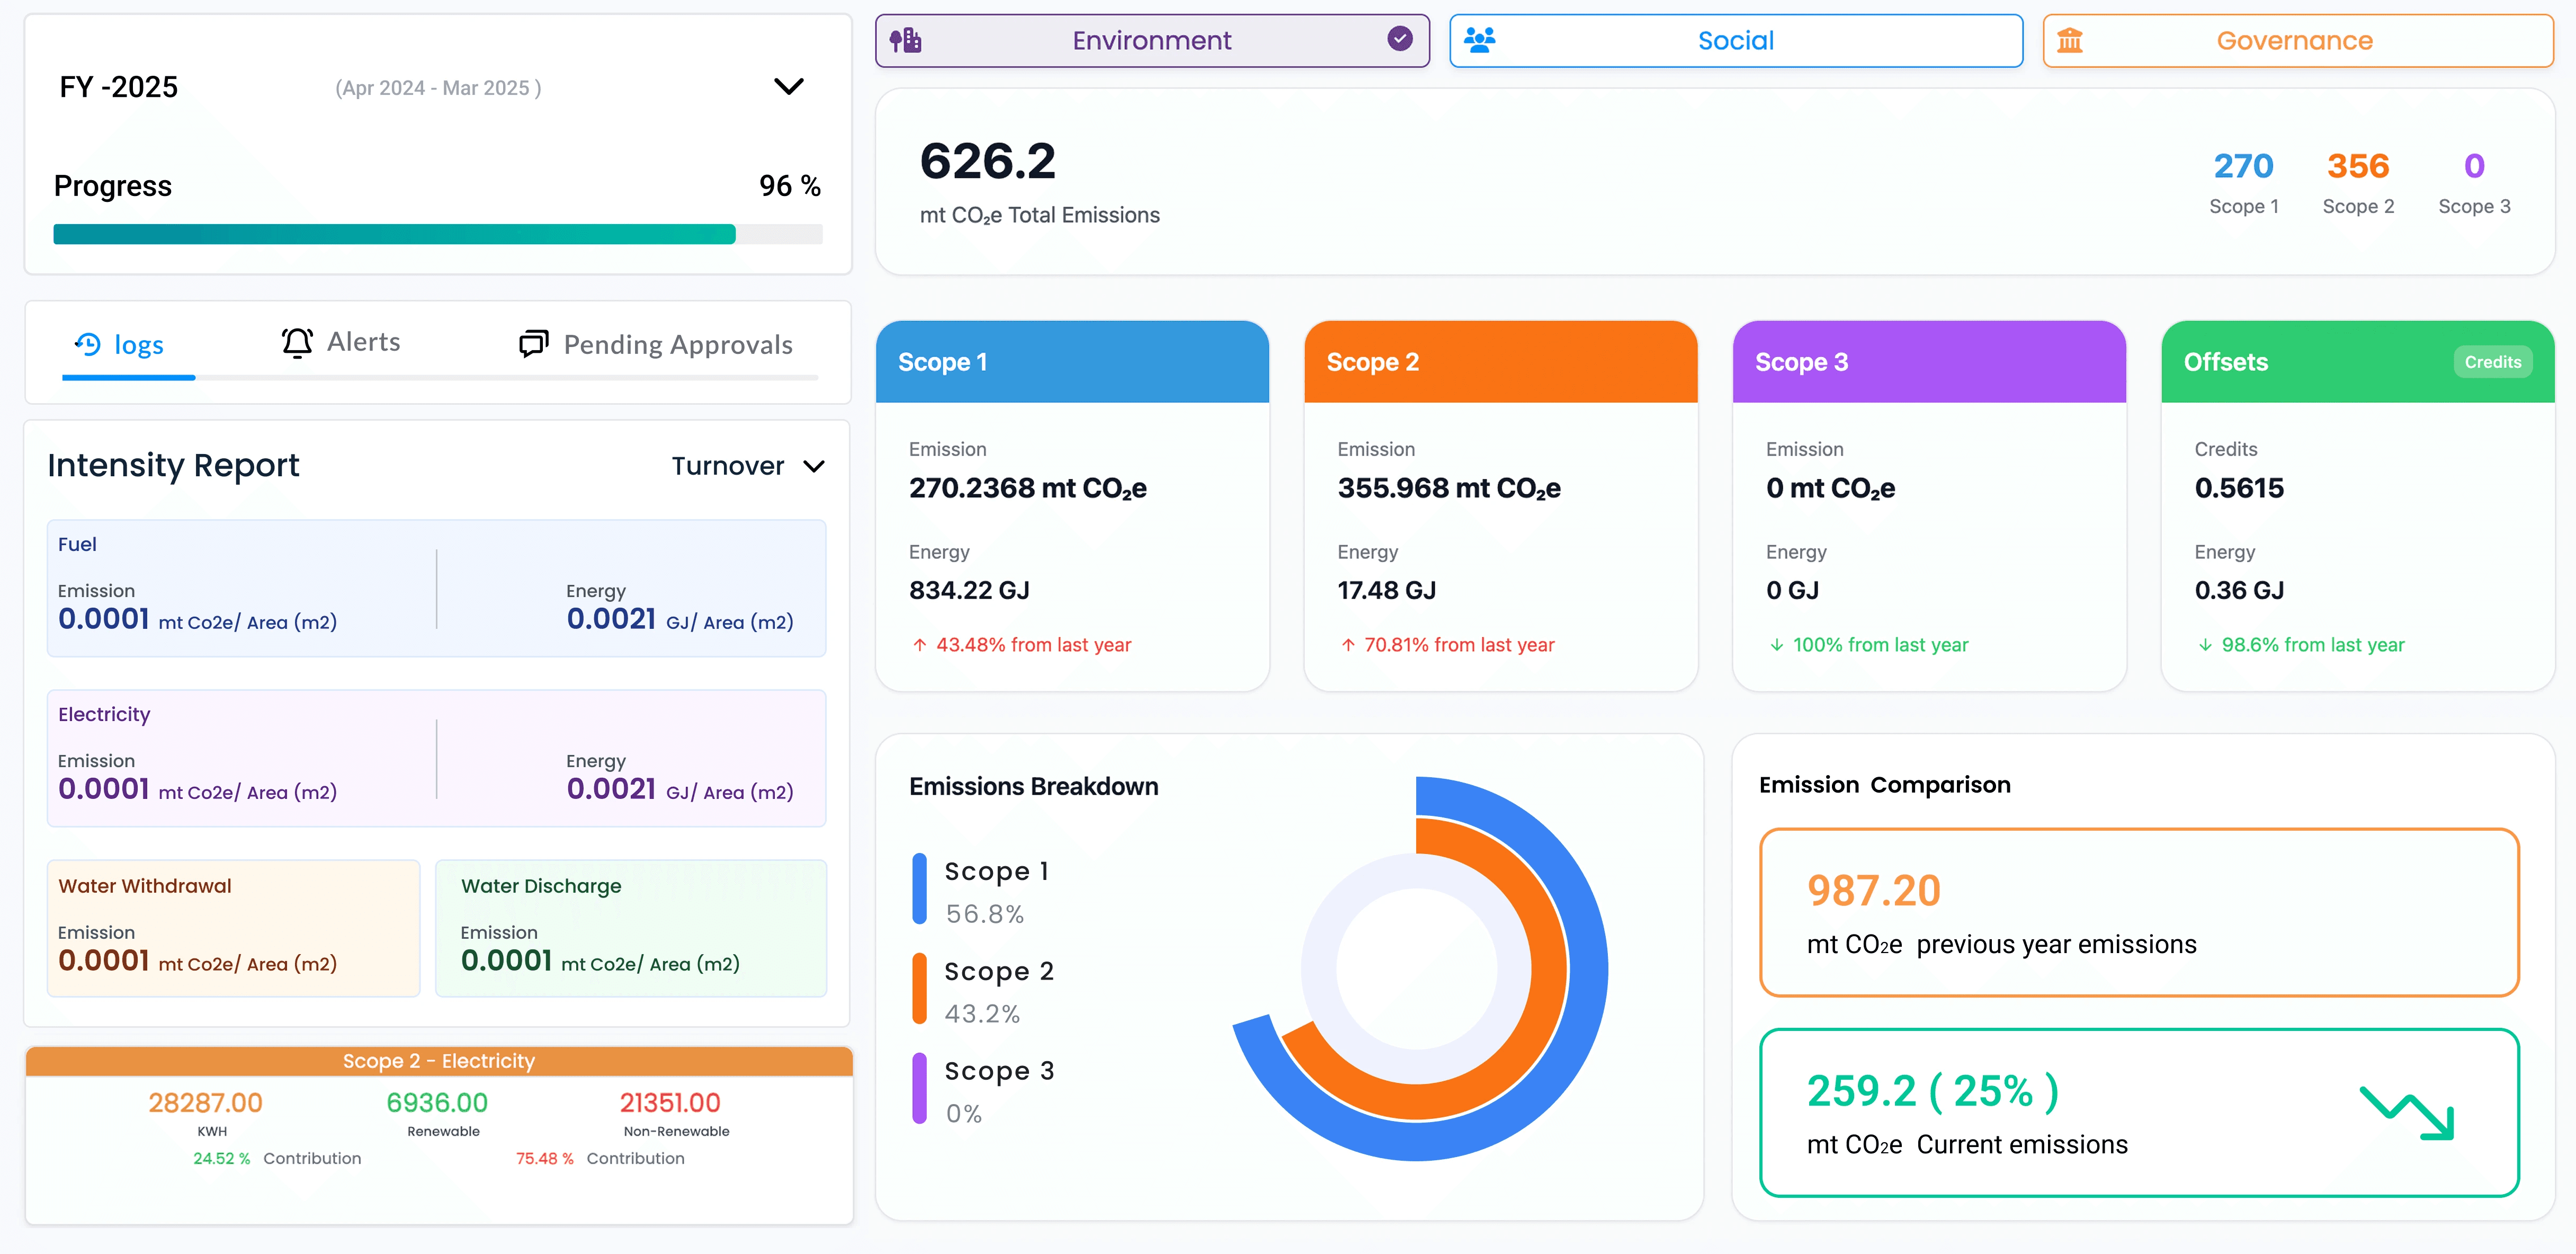
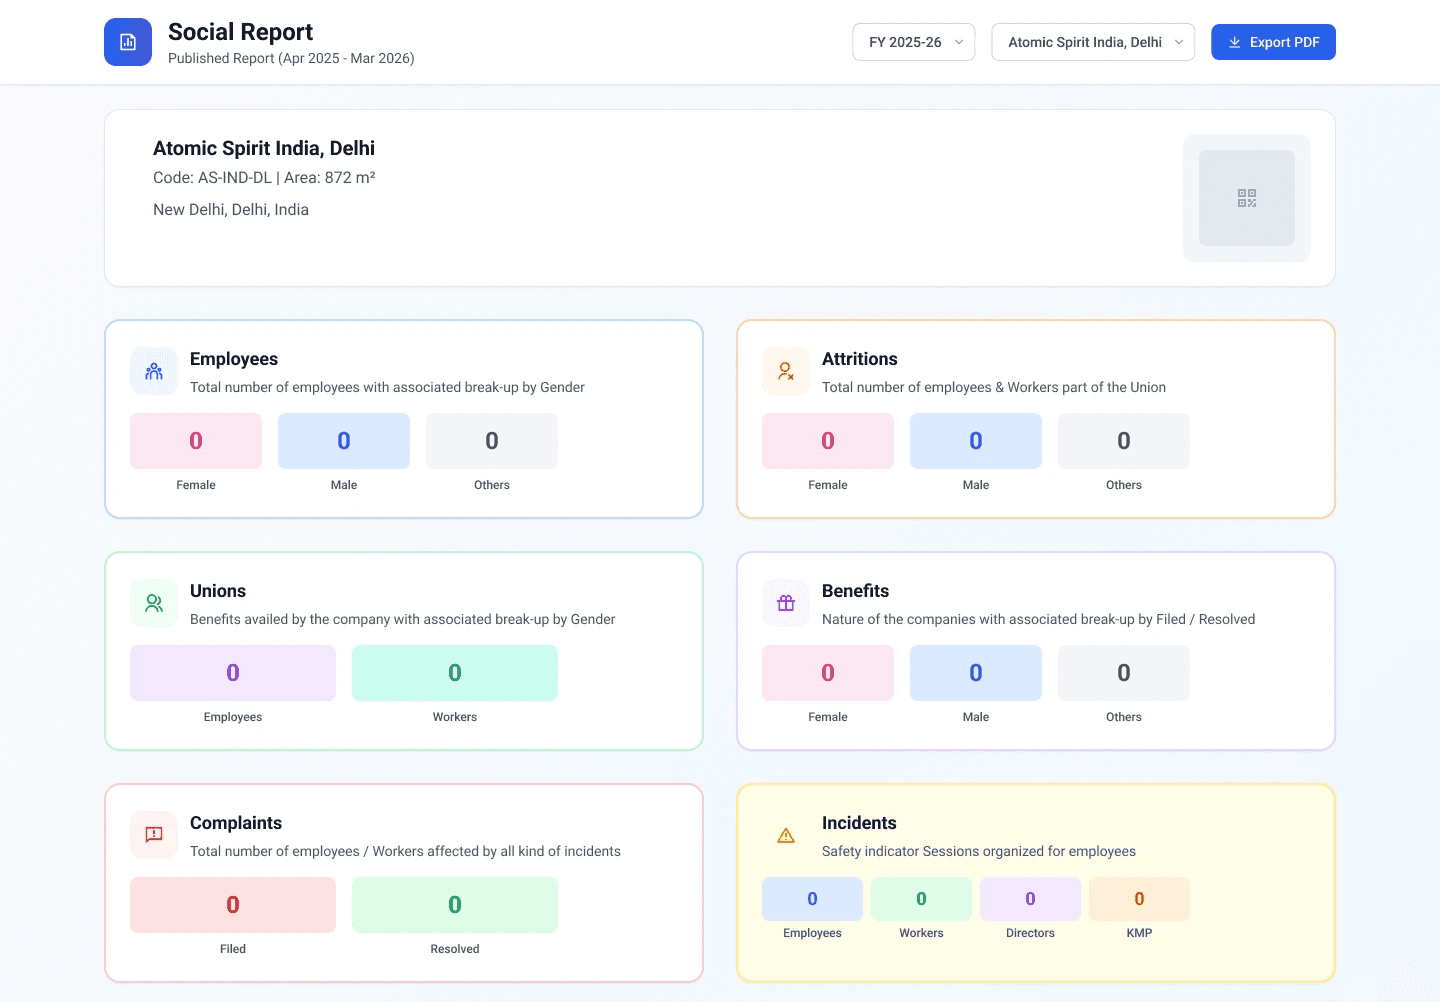
I organized the platform around financial year, organization or facility, and ESG pillar. Within Environment, emissions are separated into Scope 1, Scope 2, Scope 3, and offsets; Social uses clear indicator groups such as employees, attrition, unions, benefits, complaints, and incidents.
2. Designing for review and accountability
Logs, alerts, pending approvals, report IDs, publication periods, and organization selectors stay close to the data they govern. This supports review workflows and helps users understand what is current, complete, or awaiting action.
3. Making dense data readable
Summary cards, color-coded categories, comparison panels, charts, and consistent unit labels create layers of information. Users can scan overall progress first, then move into intensity reports or individual indicators when deeper analysis is required.
The Solution
My ESG Planet brings data entry, monitoring, comparison, approvals, and reporting into a consistent enterprise interface. The product emphasizes traceability and decision support rather than treating dashboards as decoration.
A unified ESG dashboard
Environment, Social, and Governance remain part of one product structure, with financial-year progress and organization context carried across the experience.
Emissions and intensity reporting
Scope 1–3 totals, energy values, offsets, contribution breakdowns, and year-over-year comparison are presented through cards and charts that support both scanning and detailed review.
Social performance views
Workforce, attrition, union, benefit, complaint, and incident indicators use a repeatable card pattern, making a broad reporting domain easier to navigate and compare.
Report-ready workflows
Filters, publication details, organization selection, approvals, and PDF export are integrated into reporting views so users can move from monitoring to formal output without rebuilding context.

Outcome
The final product direction turns ESG reporting into a structured, repeatable workflow. It gives sustainability teams a shared view of progress and performance while keeping the detailed evidence and organizational context needed for review.
What the design achieved
A consistent information hierarchy now connects high-level ESG progress with detailed emissions, intensity, and social indicators. Reusable reporting patterns help the system accommodate additional metrics without fragmenting the experience.
Key learning
Enterprise dashboards become useful when every visualization answers a task: monitor progress, find an exception, compare periods, approve data, or prepare a report. Clear context and traceability matter as much as visual simplicity.